GW31 -- Preview
TLDR:
- Both models captain Bruno Fernandes (6.85 xP) with identical transfer strategy for GW31: O’Reilly and Rice out for Thiaw and Wilson
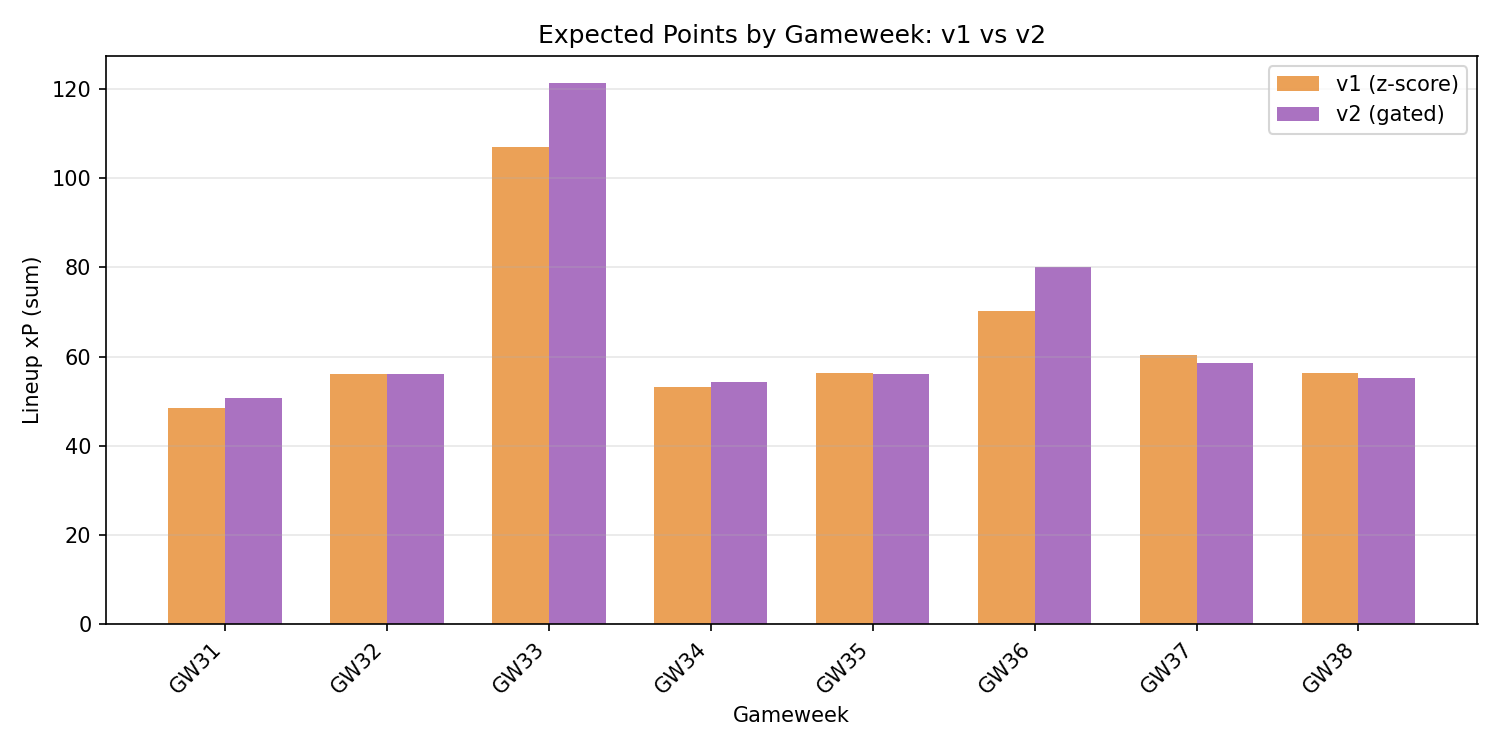
- Strong squad agreement with 8/11 identical players, but v2 projects 2.2 points higher (50.7 vs 48.5)
- Main difference in defense: v1 starts Virgil/Andersen/Thiaw while v2 opts for Thiaw/Virgil/Andersen in different order
- Both models deploy wildcard in GW32 but with significantly different squad builds
- v1’s z-score adjustments heavily penalize forwards with zero elite ownership, creating largest projection gaps
Squad Picks (GW31)
The models show strong consensus on core picks, agreeing on 8 of 11 starting players including the Bruno Fernandes captaincy and Wilson vice-captaincy. The key difference lies in defensive ordering, with both models selecting the same three defenders (Virgil, Andersen, Thiaw) but in different configurations. Version 2’s superior projected total (50.7 vs 48.5) stems from avoiding v1’s harsh z-score penalties on certain players. Both squads maintain identical structure with 5 midfielders including premium options and double up on forwards with Thiago and Ekitiké.
| Slot | v1_Player | v1_xP | v2_Player | v2_xP | Match |
|---|---|---|---|---|---|
| XI | Darlow | 2.63 | Darlow | 3.09 | = |
| XI | Virgil | 4.63 | Thiaw | 4.58 | ~ |
| XI | Andersen | 4.36 | Virgil | 4.48 | ~ |
| XI | Thiaw | 3.96 | Andersen | 4.44 | ~ |
| XI | B.Fernandes (C) | 6.85 | B.Fernandes (C) | 6.85 | = |
| XI | Wilson (V) | 5.19 | Wilson | 5.08 | = |
| XI | Anderson | 4.26 | Anderson | 4.54 | = |
| XI | Ndiaye | 3.77 | Ndiaye | 4.31 | = |
| XI | Enzo | 3.63 | Enzo | 3.98 | = |
| XI | Thiago | 5.16 | Thiago (V) | 5.16 | = |
| XI | Ekitiké | 4.06 | Ekitiké | 4.16 | = |
| B0 | Raya | 0.00 | Raya | 0.00 | = |
| B2 | Richards | 0.00 | Richards | 0.00 | = |
| B3 | Gabriel | 0.00 | Gabriel | 0.00 | = |
| B1 | Beto | 2.36 | Beto | 2.95 | = |
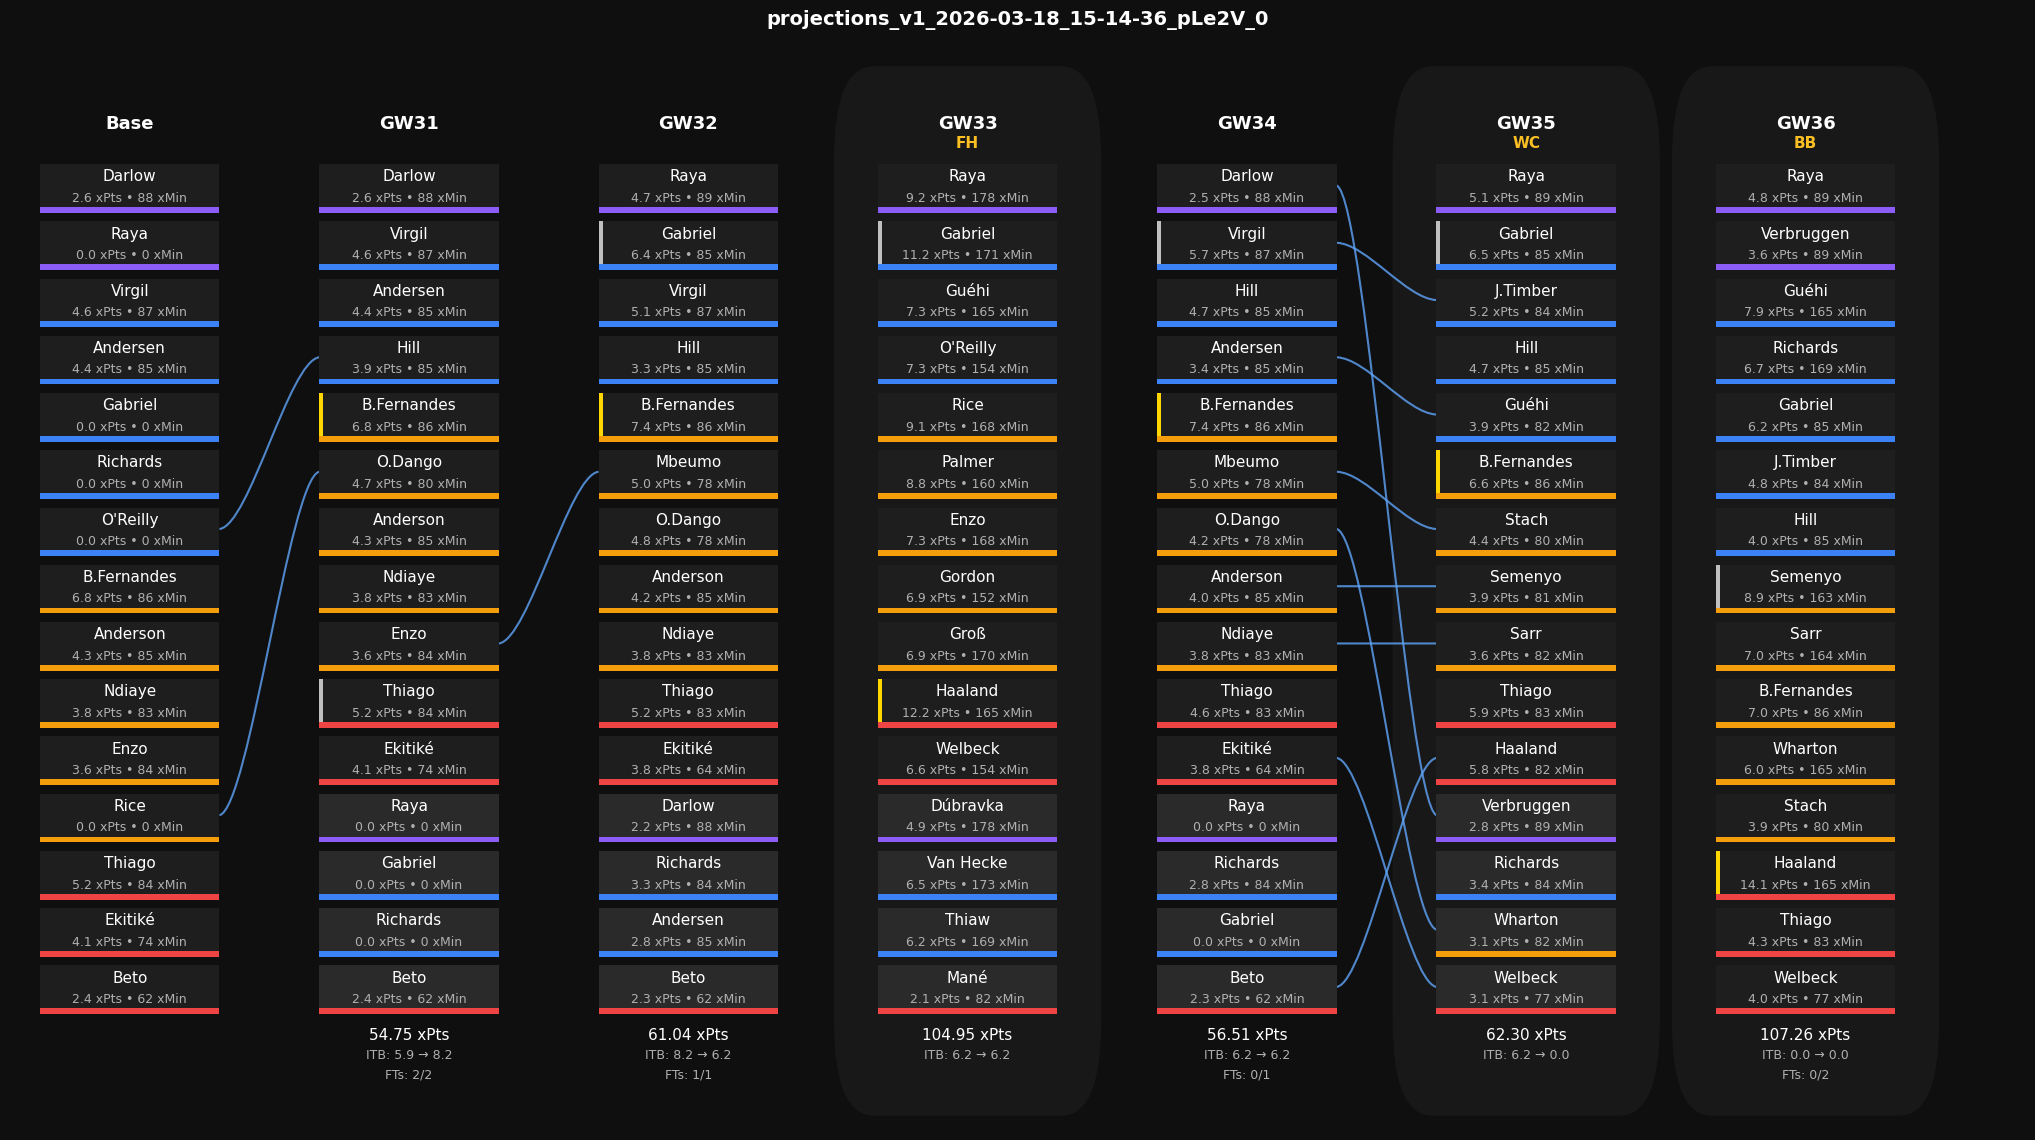
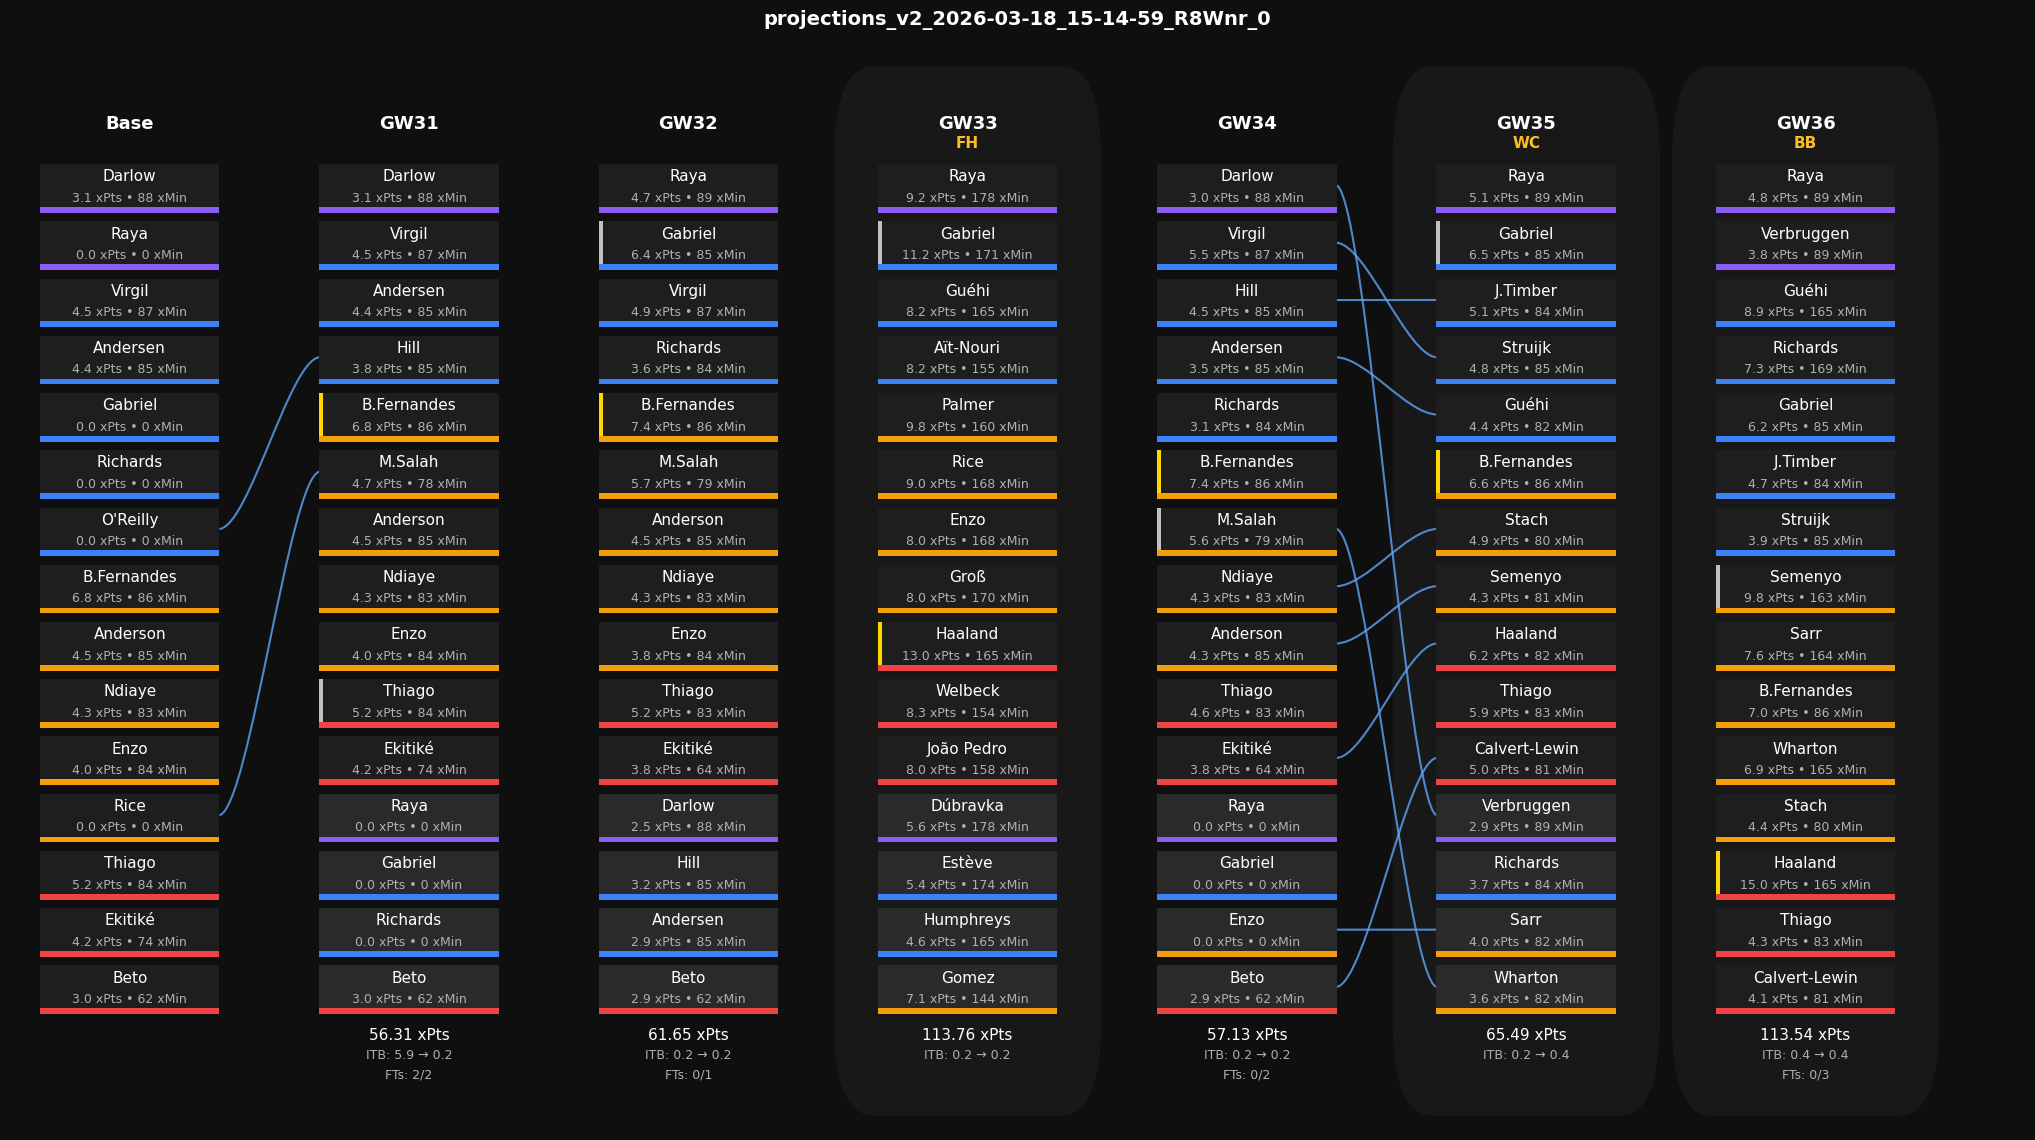
Transfer Plan
Both models execute identical GW31 transfers, moving O’Reilly and Rice out for Thiaw and Wilson, suggesting this move has strong consensus backing. The real divergence emerges in GW32 wildcard strategy, where v1 and v2 construct entirely different squads despite using the same chip. Version 1 brings in players like J.Timber, Groß, and Haaland, while v2 opts for Van Hecke, Anthony, and different supporting cast. This highlights how the different projection methodologies lead to vastly different optimal squad compositions when rebuilding from scratch.
| GW | v1_Transfers | v1_Chip | v2_Transfers | v2_Chip | Match |
|---|---|---|---|---|---|
| 31 | O’Reilly, Rice -> Thiaw, Wilson | O’Reilly, Rice -> Thiaw, Wilson | = | ||
| 32 | Darlow, Andersen, Richards, Thiaw, Enzo, Wilson, Ndiaye, Beto, Ekitiké -> J.Timber, Groß, O.Dango, Welbeck, Haaland, Dúbravka, Gomez, O’Reilly, Guéhi | WC | Darlow, Andersen, Richards, Virgil, Wilson, Ndiaye, Anderson, Beto, Ekitiké -> Van Hecke, Anthony, Groß, Rice, Welbeck, Haaland, Dúbravka, Aït-Nouri, Guéhi | WC | DIFF |
| 33 | Roll | BB | Roll | BB | = |
| 34 | Roll | FH | Roll | FH | = |
| 35 | Roll | Roll | = | ||
| 36 | Groß -> Wilson | Thiaw, Van Hecke -> Richards, Lacroix | DIFF | ||
| 37 | Roll | Roll | = | ||
| 38 | Roll | Roll | = |
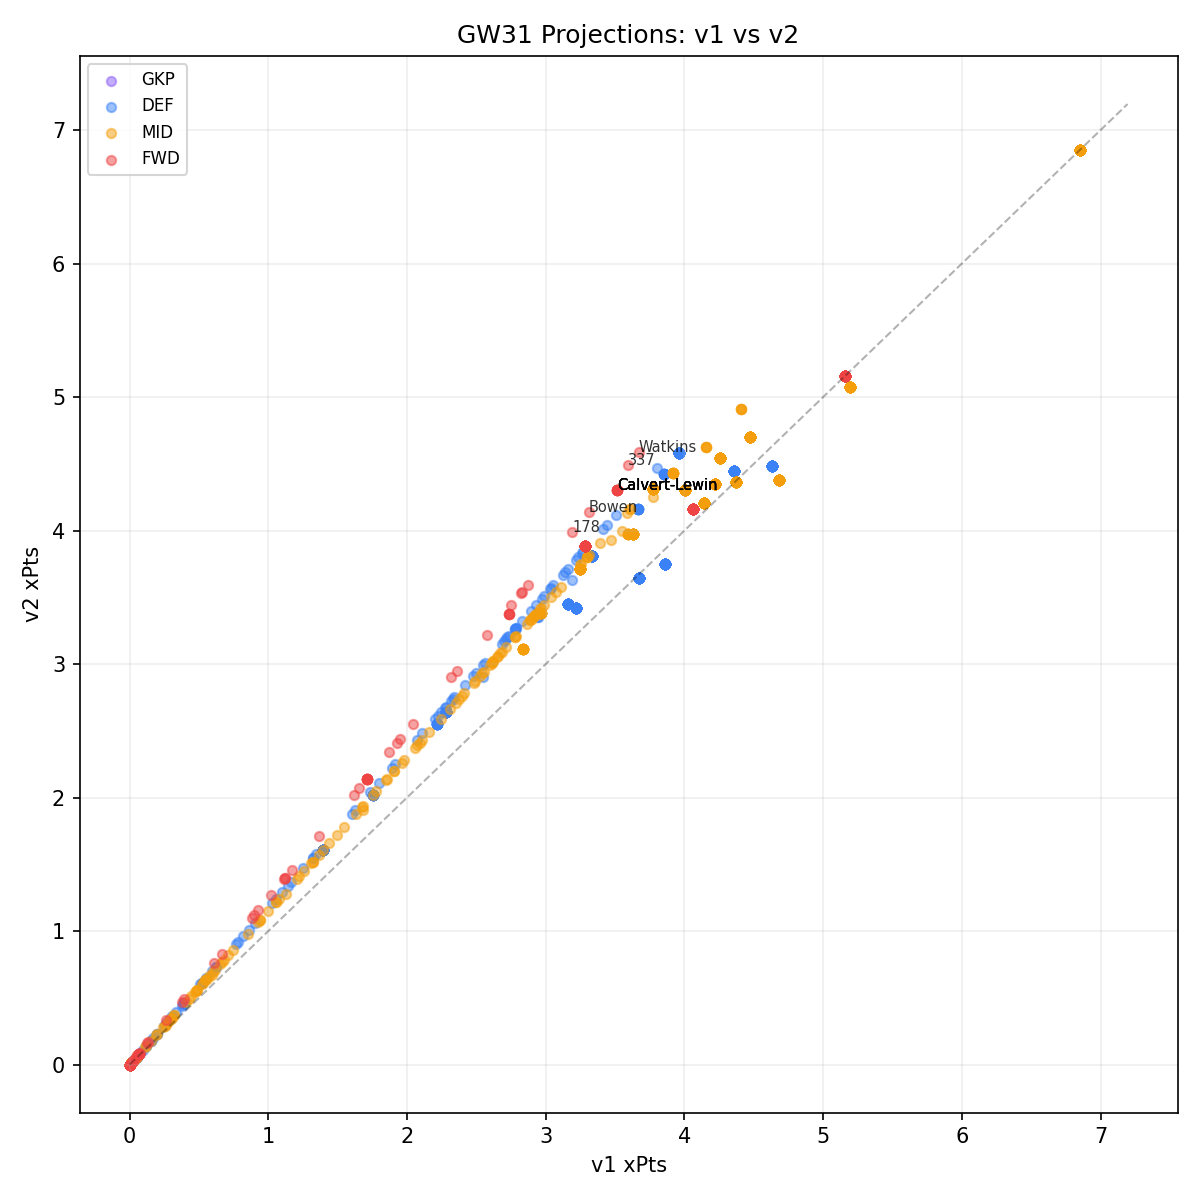
Model Divergence
The largest model disagreements center on forwards with zero or minimal elite ownership, where v1’s z-score methodology applies significant penalties. Watkins, Jiménez, and Welbeck show 0.8-0.9 point gaps, with v1 dramatically reducing their appeal despite strong baseline projections. This pattern reveals v1’s systematic bias against players ignored by elite managers, while v2’s confidence-gated approach preserves baseline projections when elite signals lack conviction. The divergences concentrate almost entirely in forwards and fringe defenders, suggesting elite managers’ positional preferences heavily influence v1’s midfielder and premium player valuations.
| Name | Pos | Team | v1_xP | v2_xP | delta |
|---|---|---|---|---|---|
| Ollie Watkins | FWD | Aston Villa | 3.67 | 4.59 | 0.92 |
| Raúl Jiménez Rodríguez | FWD | Fulham | 3.59 | 4.49 | 0.90 |
| Jarrod Bowen | FWD | West Ham | 3.31 | 4.14 | 0.83 |
| Danny Welbeck | FWD | Brighton | 3.19 | 3.99 | 0.80 |
| Dominic Calvert-Lewin | FWD | Leeds United | 3.51 | 4.30 | 0.79 |
| Benjamin Sesko | FWD | Man Utd | 2.87 | 3.59 | 0.72 |
| Dominic Solanke-Mitchell | FWD | Spurs | 2.83 | 3.54 | 0.71 |
| Igor Jesus Maciel da Cruz | FWD | Nott’m Forest | 2.82 | 3.53 | 0.71 |
| ID:791 | FWD | West Ham | 2.75 | 3.44 | 0.69 |
| Kenny Tete | DEF | Fulham | 3.80 | 4.47 | 0.67 |
Charts