GW32 -- Preview
TLDR:
- Both models captain Bruno Fernandes despite only 1/11 starting XI agreement
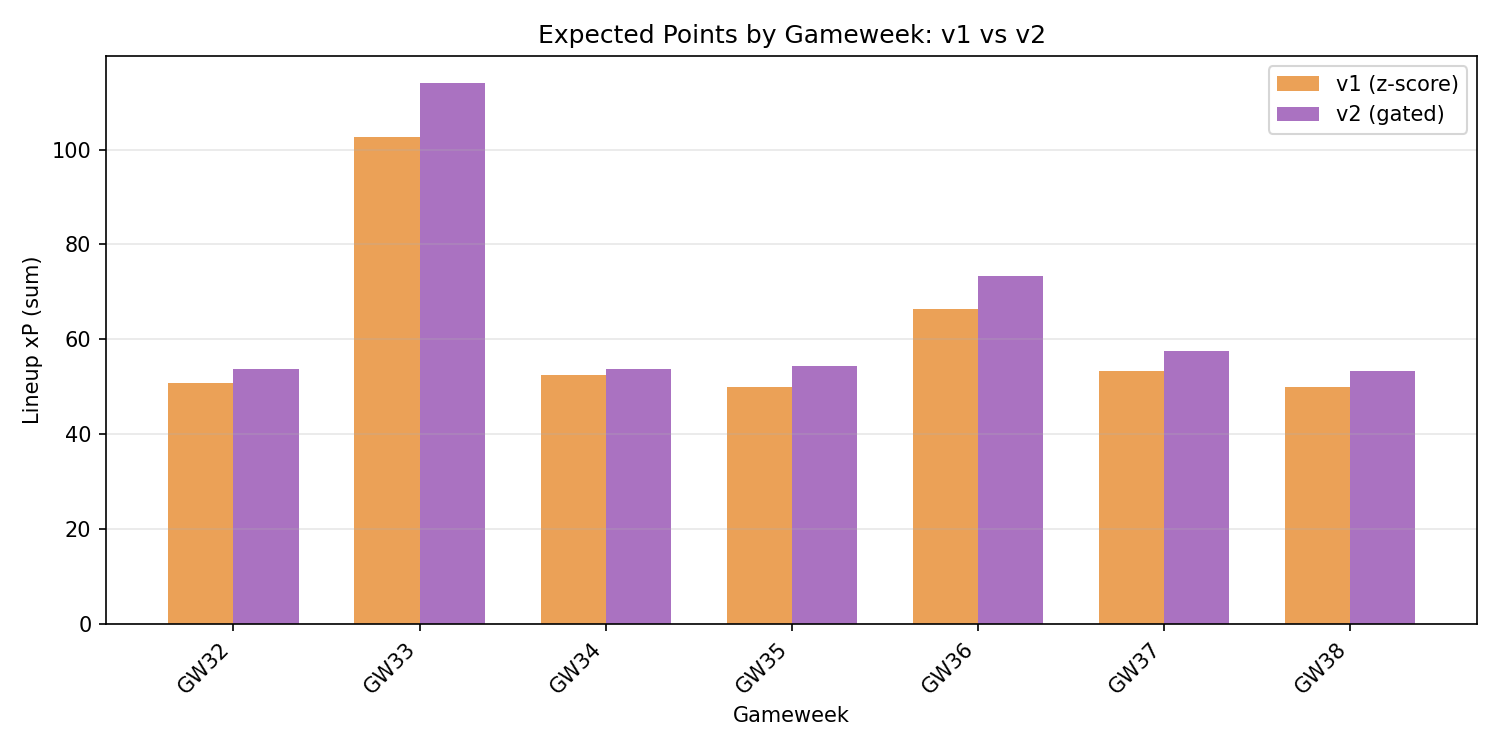
- v2 model projects 2.9 points higher (53.8 vs 50.9) by trusting baseline projections more
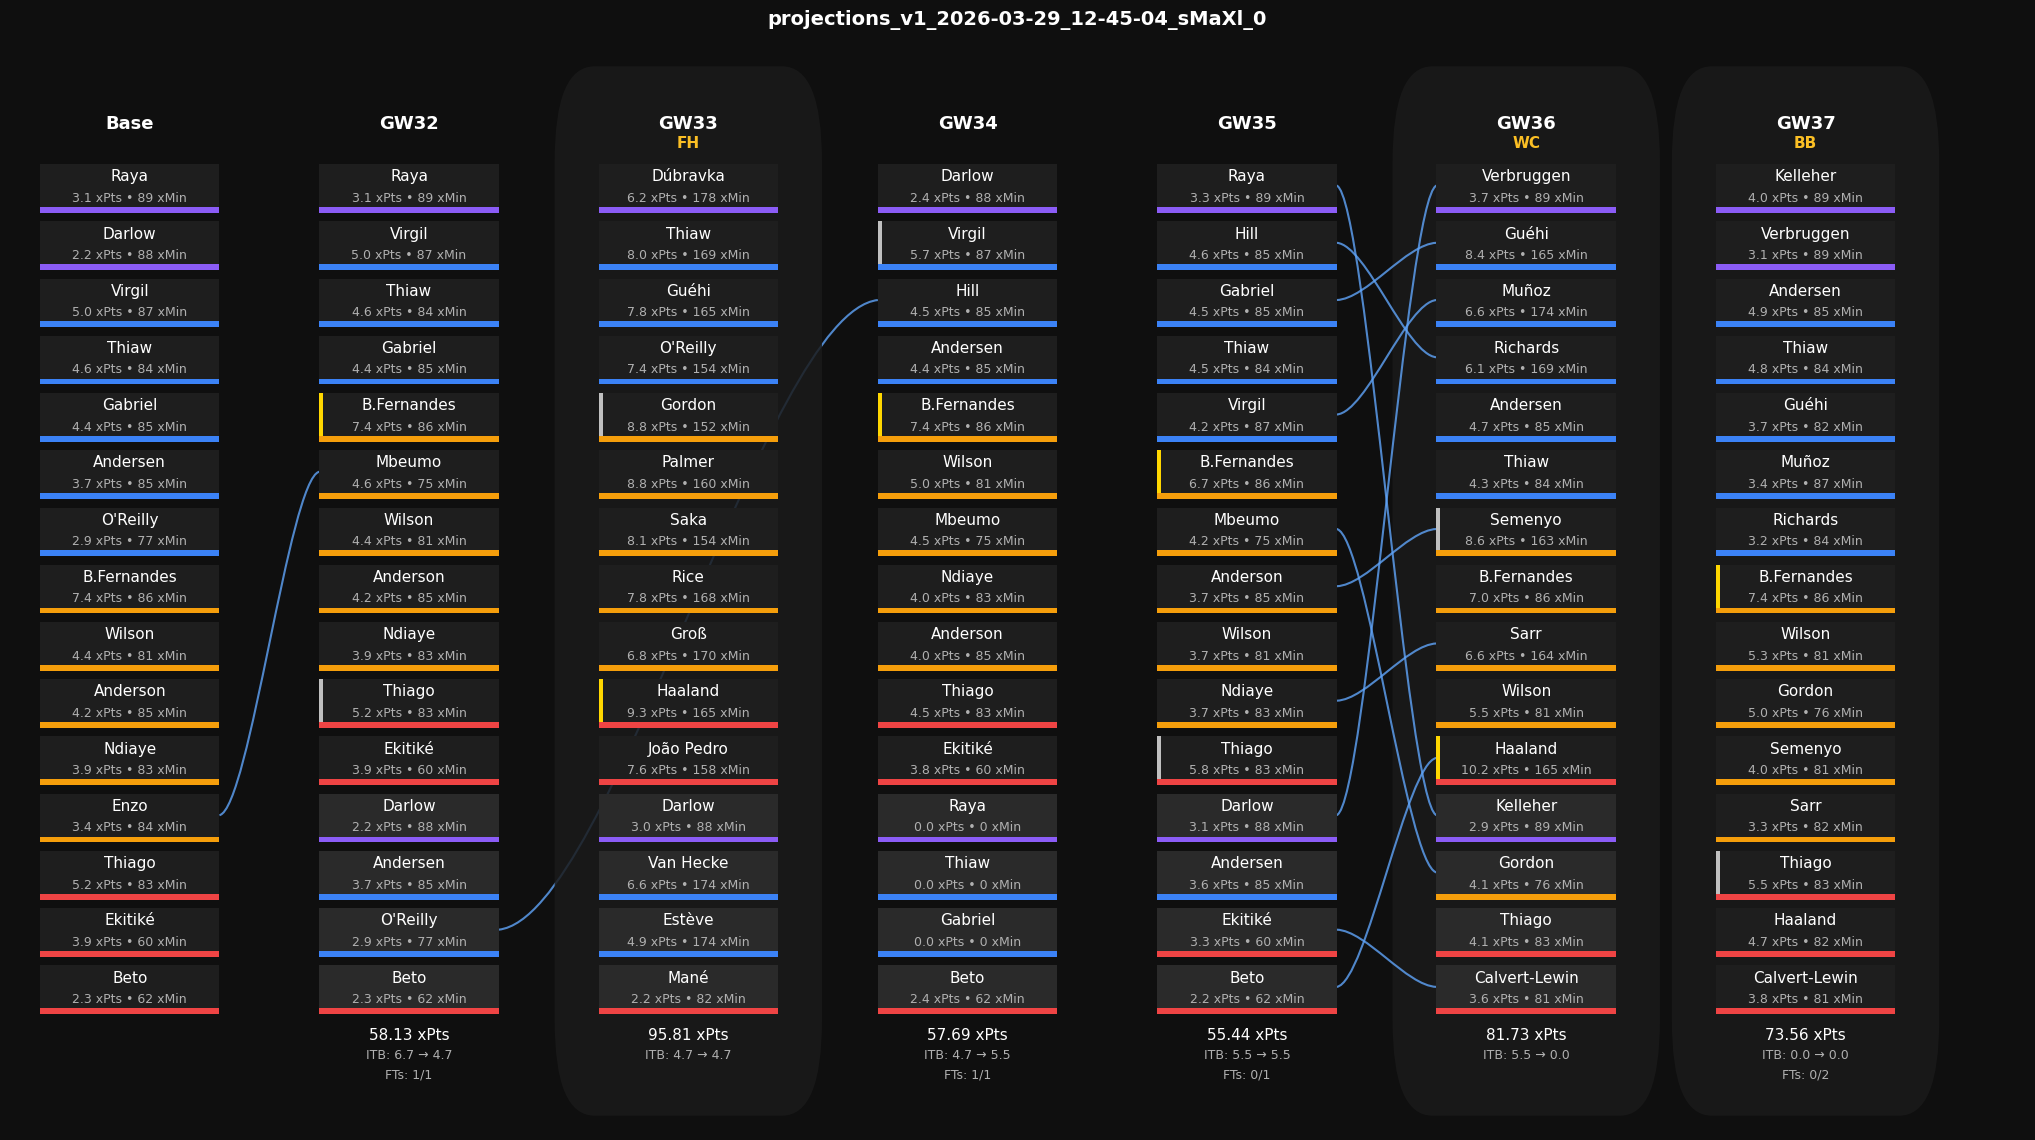
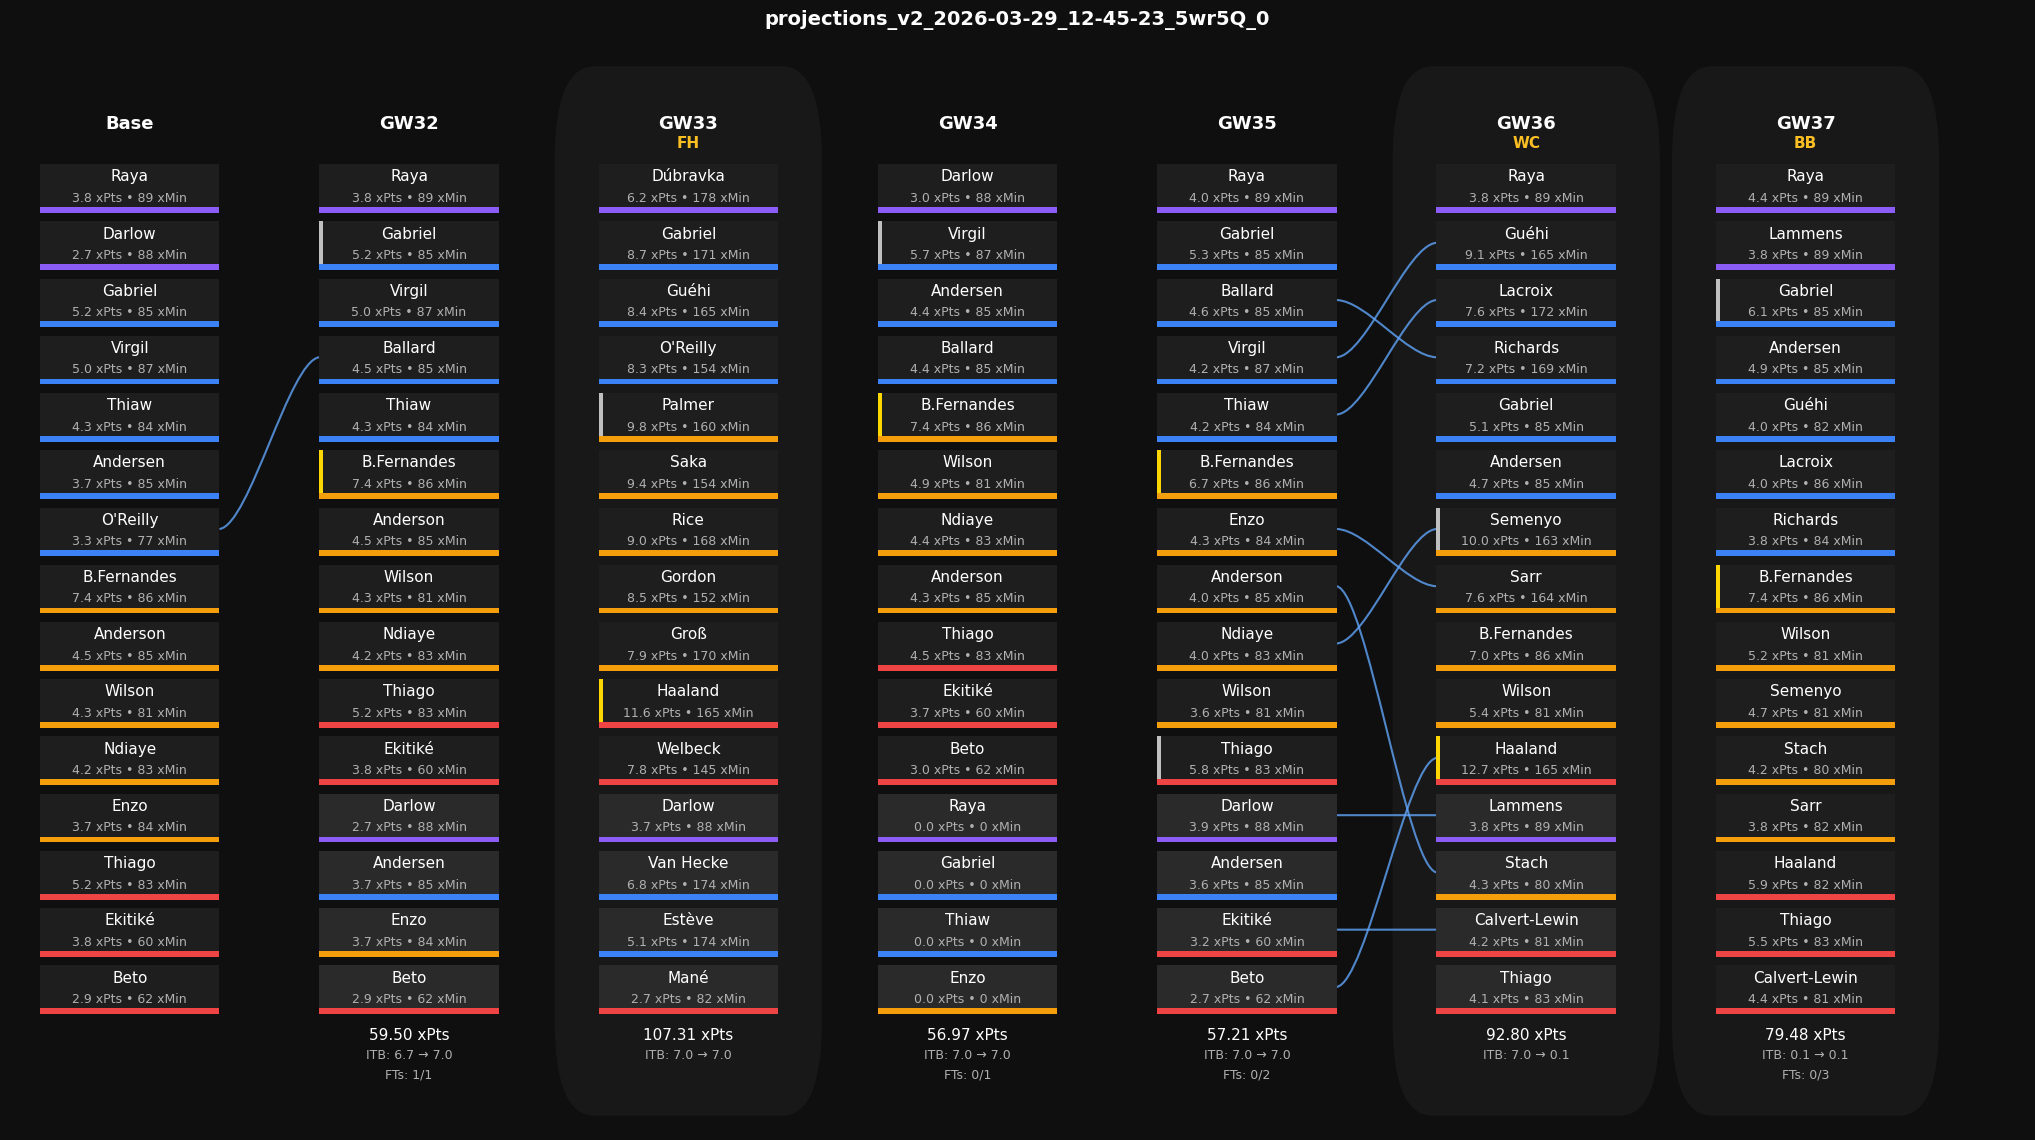
- Both trigger Wildcard in GW32 with 9-10 transfers, then BB/FH in consecutive weeks
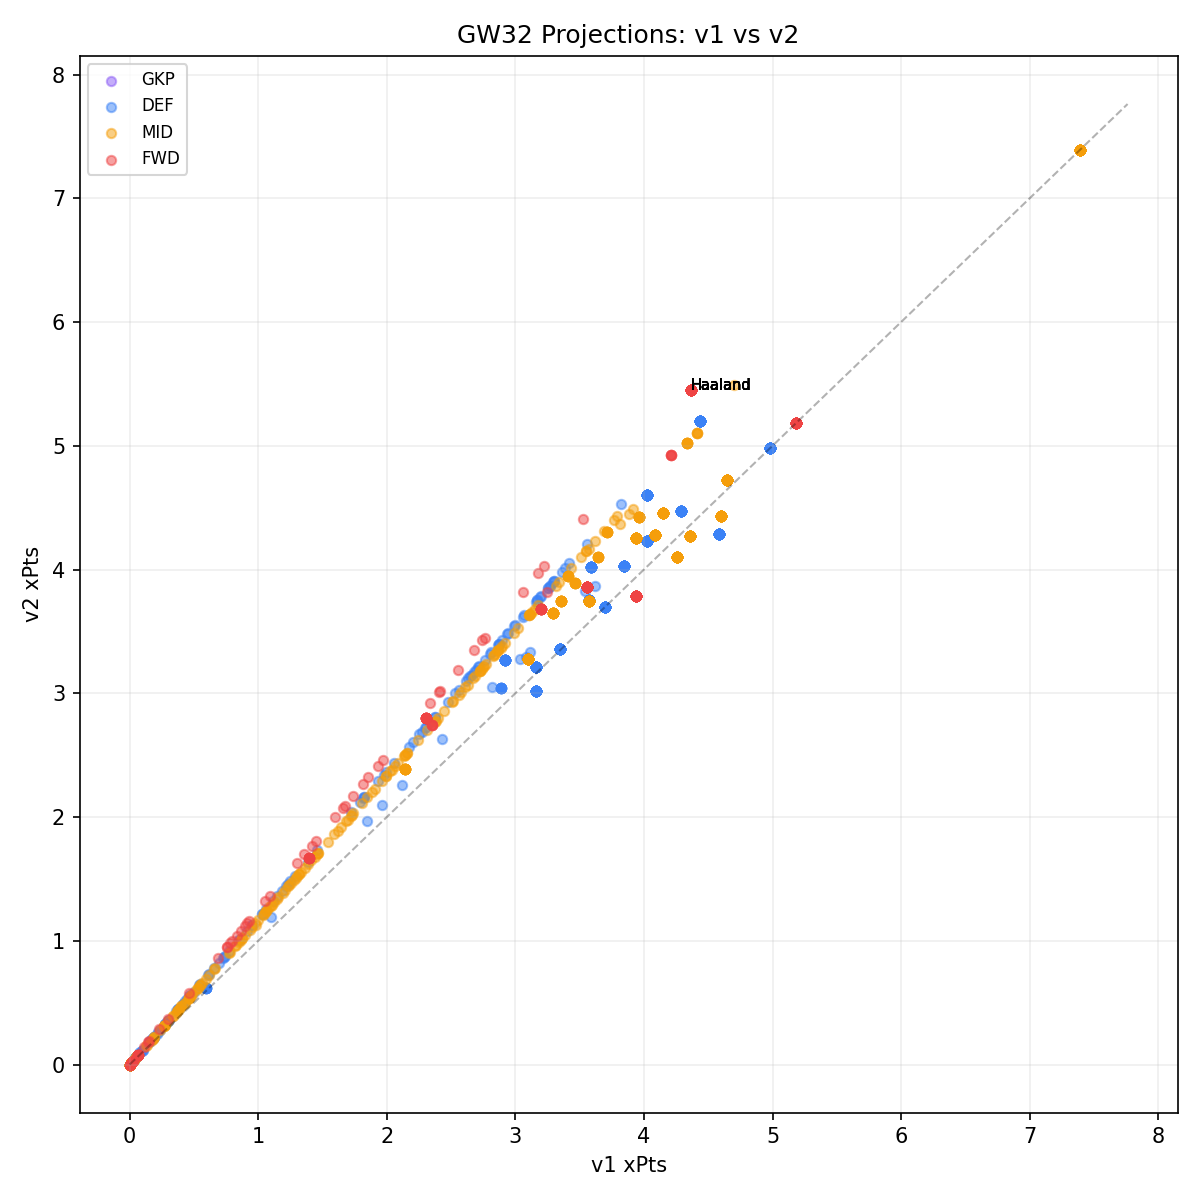
- Major divergence on Haaland: v1 downgrades him 1.09 points while v2 keeps baseline
- v1’s z-score adjustments systematically downgrade players with 0.00 elite ownership
Squad Picks (GW32)
The models show stark disagreement with only Bruno Fernandes matching in the starting XI. v2 favors Arsenal assets heavily with Gabriel (5.20 xP), J.Timber (4.60), and Gomez (4.15), while v1 spreads risk across Newcastle’s Dúbravka and Brighton’s Van Hecke. Both include premium midfielders Rice and Gordon, but v1 opts for Wilson over v2’s Gomez in the final midfield slot. The 2.9-point projection gap suggests v1’s elite ownership adjustments are overly conservative for this gameweek.
| Slot | v1_Player | v1_xP | v2_Player | v2_xP | Match |
|---|---|---|---|---|---|
| XI | Dúbravka | 3.58 | Verbruggen | 3.66 | ~ |
| XI | Thiaw | 4.58 | Gabriel | 5.20 | ~ |
| XI | Gabriel | 4.44 | J.Timber | 4.60 | DIFF |
| XI | Van Hecke | 4.29 | Thiaw | 4.29 | DIFF |
| XI | B.Fernandes (C) | 7.39 | B.Fernandes (C) | 7.39 | = |
| XI | Gordon | 4.60 | Rice | 5.02 | ~ |
| XI | Wilson | 4.36 | Gordon | 4.43 | DIFF |
| XI | Rice | 4.34 | Groß | 4.40 | ~ |
| XI | Groß | 3.77 | Gomez | 4.15 | DIFF |
| XI | Thiago (V) | 5.18 | Haaland (V) | 5.45 | ~ |
| XI | Haaland | 4.36 | Thiago | 5.18 | ~ |
| B0 | Verbruggen | 3.45 | Dúbravka | 3.58 | ~ |
| B2 | Guéhi | 3.03 | Guéhi | 3.28 | = |
| B3 | O’Reilly | 2.92 | O’Reilly | 3.27 | = |
| B1 | Calvert-Lewin | 3.20 | Calvert-Lewin | 3.68 | = |
Transfer Plan
Both models execute similar Wildcard strategies in GW32, making 9-10 transfers to completely reshape squads for the run-in. The chip sequencing is identical: WC32, BB33, FH34, preserving flexibility for the crucial double gameweeks. Key differences emerge in GW36 transfer plans where v1 makes a single Groß to Sarr move while v2 plans a double transfer replacing Gordon and Gomez with Wilson and Sarr. This suggests v2 anticipates needing more tactical adjustments as fixtures evolve.
| GW | v1_Transfers | v1_Chip | v2_Transfers | v2_Chip | Match |
|---|---|---|---|---|---|
| 32 | Darlow, Raya, Andersen, Virgil, Enzo, Ndiaye, Anderson, Beto, Ekitiké -> Dúbravka, Van Hecke, Groß, Rice, Gordon, Haaland, Verbruggen, Calvert-Lewin, Guéhi | WC | Darlow, Raya, Andersen, Virgil, Enzo, Ndiaye, Wilson, Anderson, Beto, Ekitiké -> Verbruggen, J.Timber, Gomez, Groß, Gordon, Rice, Haaland, Dúbravka, Calvert-Lewin, Guéhi | WC | DIFF |
| 33 | Roll | BB | Roll | BB | = |
| 34 | Roll | FH | Roll | FH | = |
| 35 | Roll | Roll | = | ||
| 36 | Groß -> Sarr | Gordon, Gomez -> Wilson, Sarr | DIFF | ||
| 37 | Roll | Roll | = | ||
| 38 | Roll | Roll | = |
Model Divergence
The projection divergences reveal v1’s systematic bias against players with zero elite ownership, most notably Haaland (-1.09), Welbeck (-0.88), and Gabriel (-0.76). All top 10 divergences show v2 higher than v1, with elite_eeo values at or near 0.00, indicating v1’s z-score methodology is penalizing these players despite strong baseline projections. Only Jarrod Bowen shows minimal elite ownership (0.04), suggesting the confidence-gated approach in v2 better preserves strong underlying fundamentals. This pattern explains why v2 achieves higher overall team projection while maintaining similar structural decisions.
| Name | Pos | Team | v1_xP | v2_xP | delta |
|---|---|---|---|---|---|
| Erling Haaland | FWD | Man City | 4.36 | 5.45 | 1.09 |
| Danny Welbeck | FWD | Brighton | 3.53 | 4.41 | 0.88 |
| ID:791 | FWD | West Ham | 3.22 | 4.03 | 0.81 |
| Viktor Gyökeres | FWD | Arsenal | 3.18 | 3.97 | 0.79 |
| Bukayo Saka | MID | Arsenal | 4.70 | 5.49 | 0.79 |
| ID:730 | FWD | Sunderland | 3.06 | 3.82 | 0.76 |
| Gabriel dos Santos Magalhães | DEF | Arsenal | 4.44 | 5.20 | 0.76 |
| Jarrod Bowen | FWD | West Ham | 4.21 | 4.93 | 0.72 |
| Mads Hermansen | GK | West Ham | 3.08 | 3.79 | 0.71 |
| Daniel Ballard | DEF | Sunderland | 3.82 | 4.53 | 0.71 |
Charts