GW33 -- Preview
TLDR:
- Both models captain Haaland and vice-captain Semenyo for GW33, showing alignment on premium picks
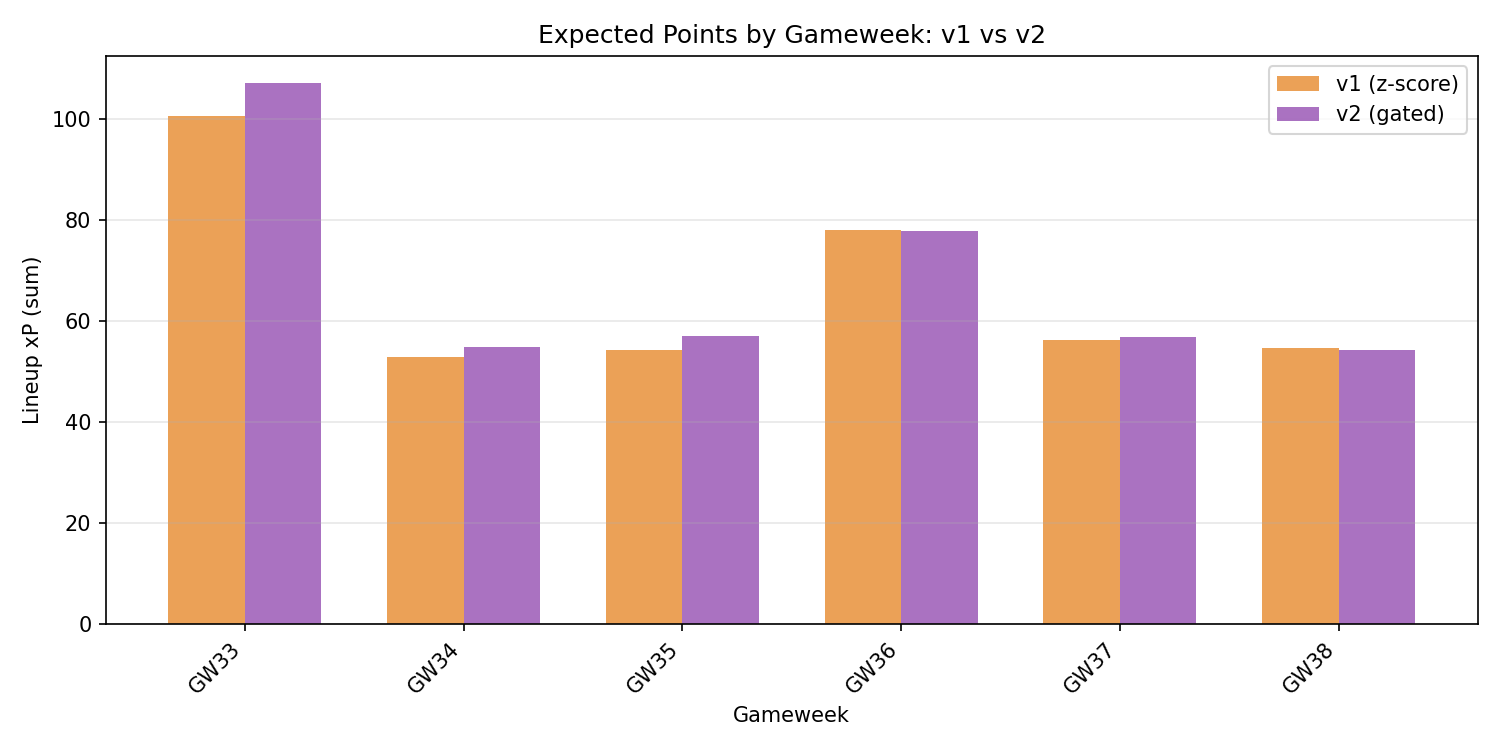
- v2 outprojects v1 with 107.1 vs 100.6 XI points, driven by higher confidence in baseline projections
- Squad agreement is strong at 10/15 players, with key differences in defense (Hill vs O’Reilly/Virgil)
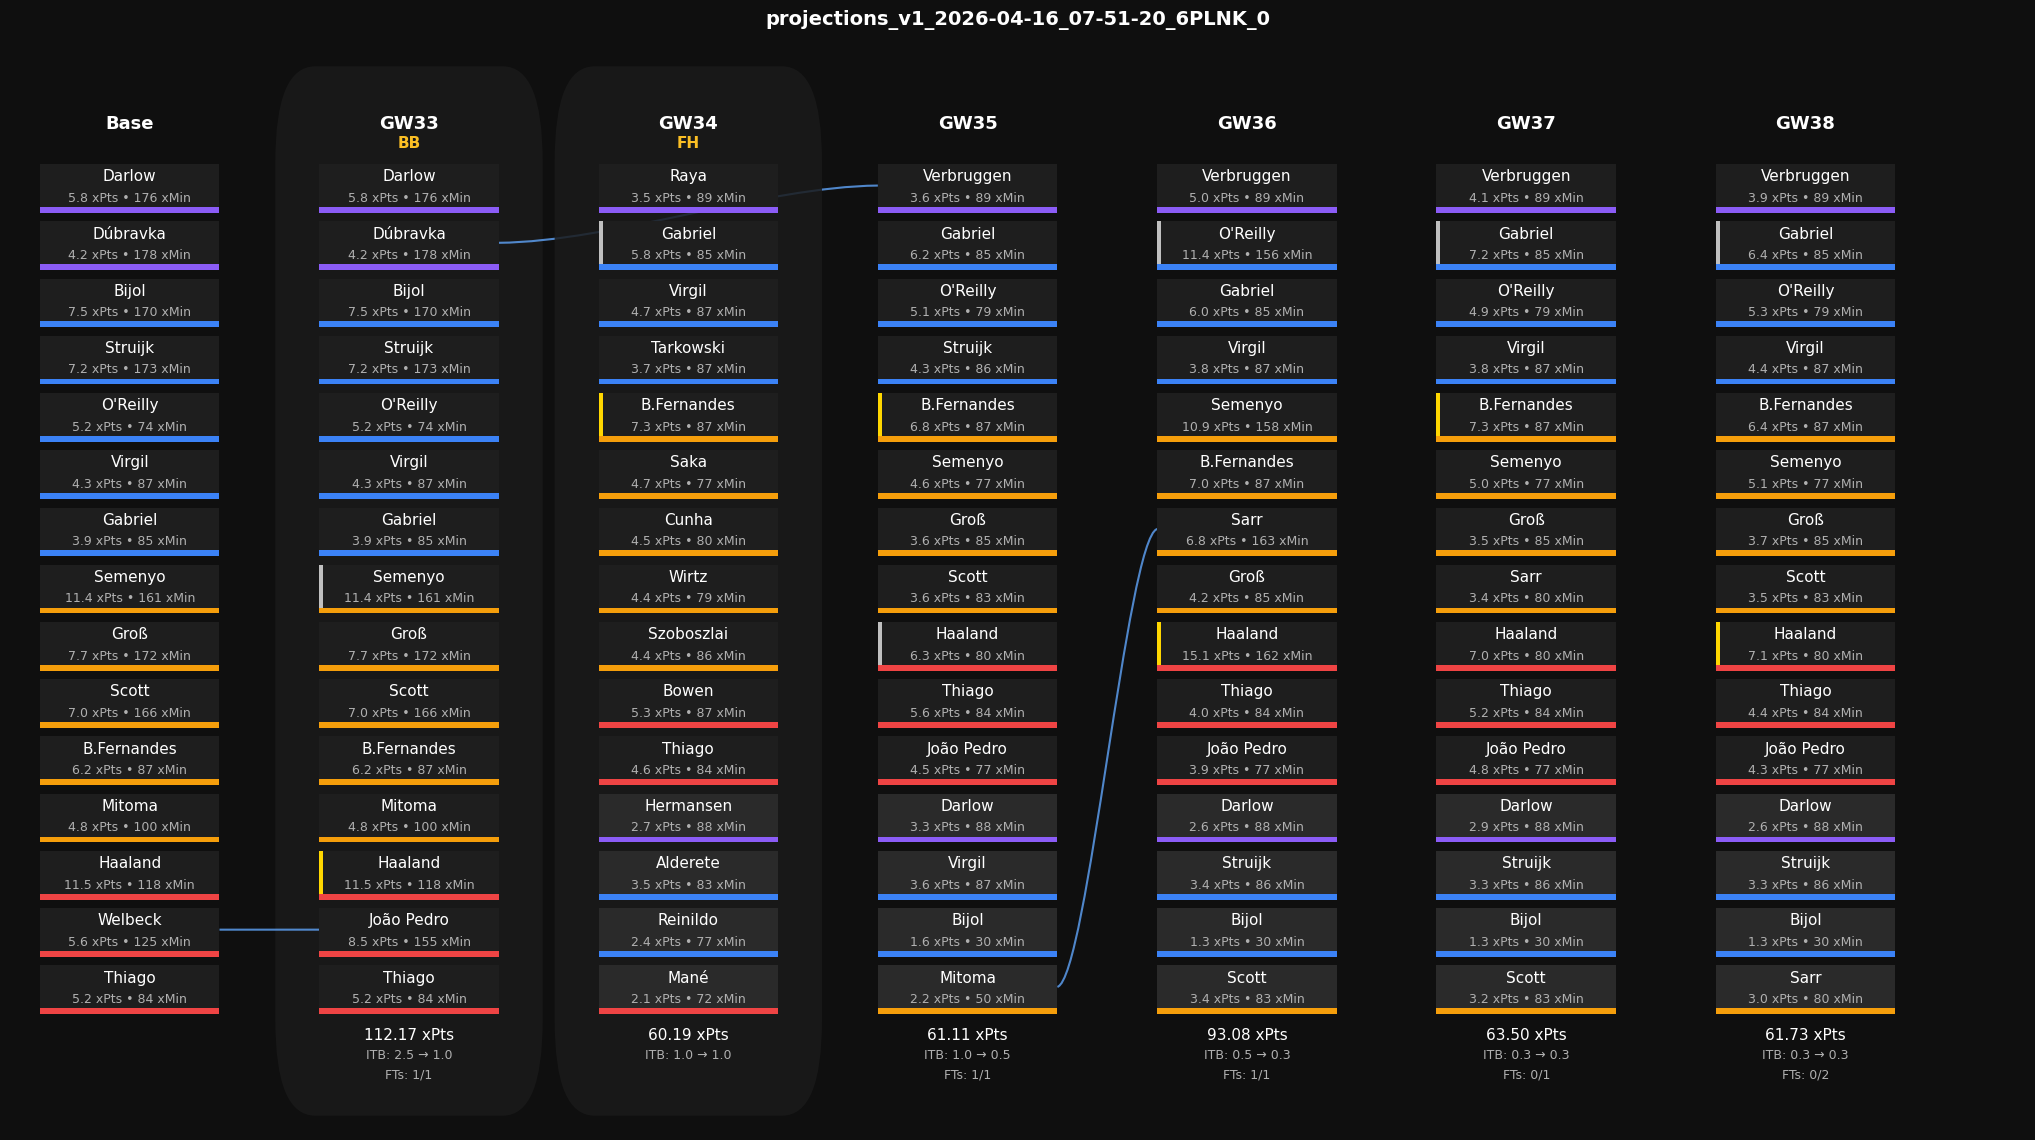
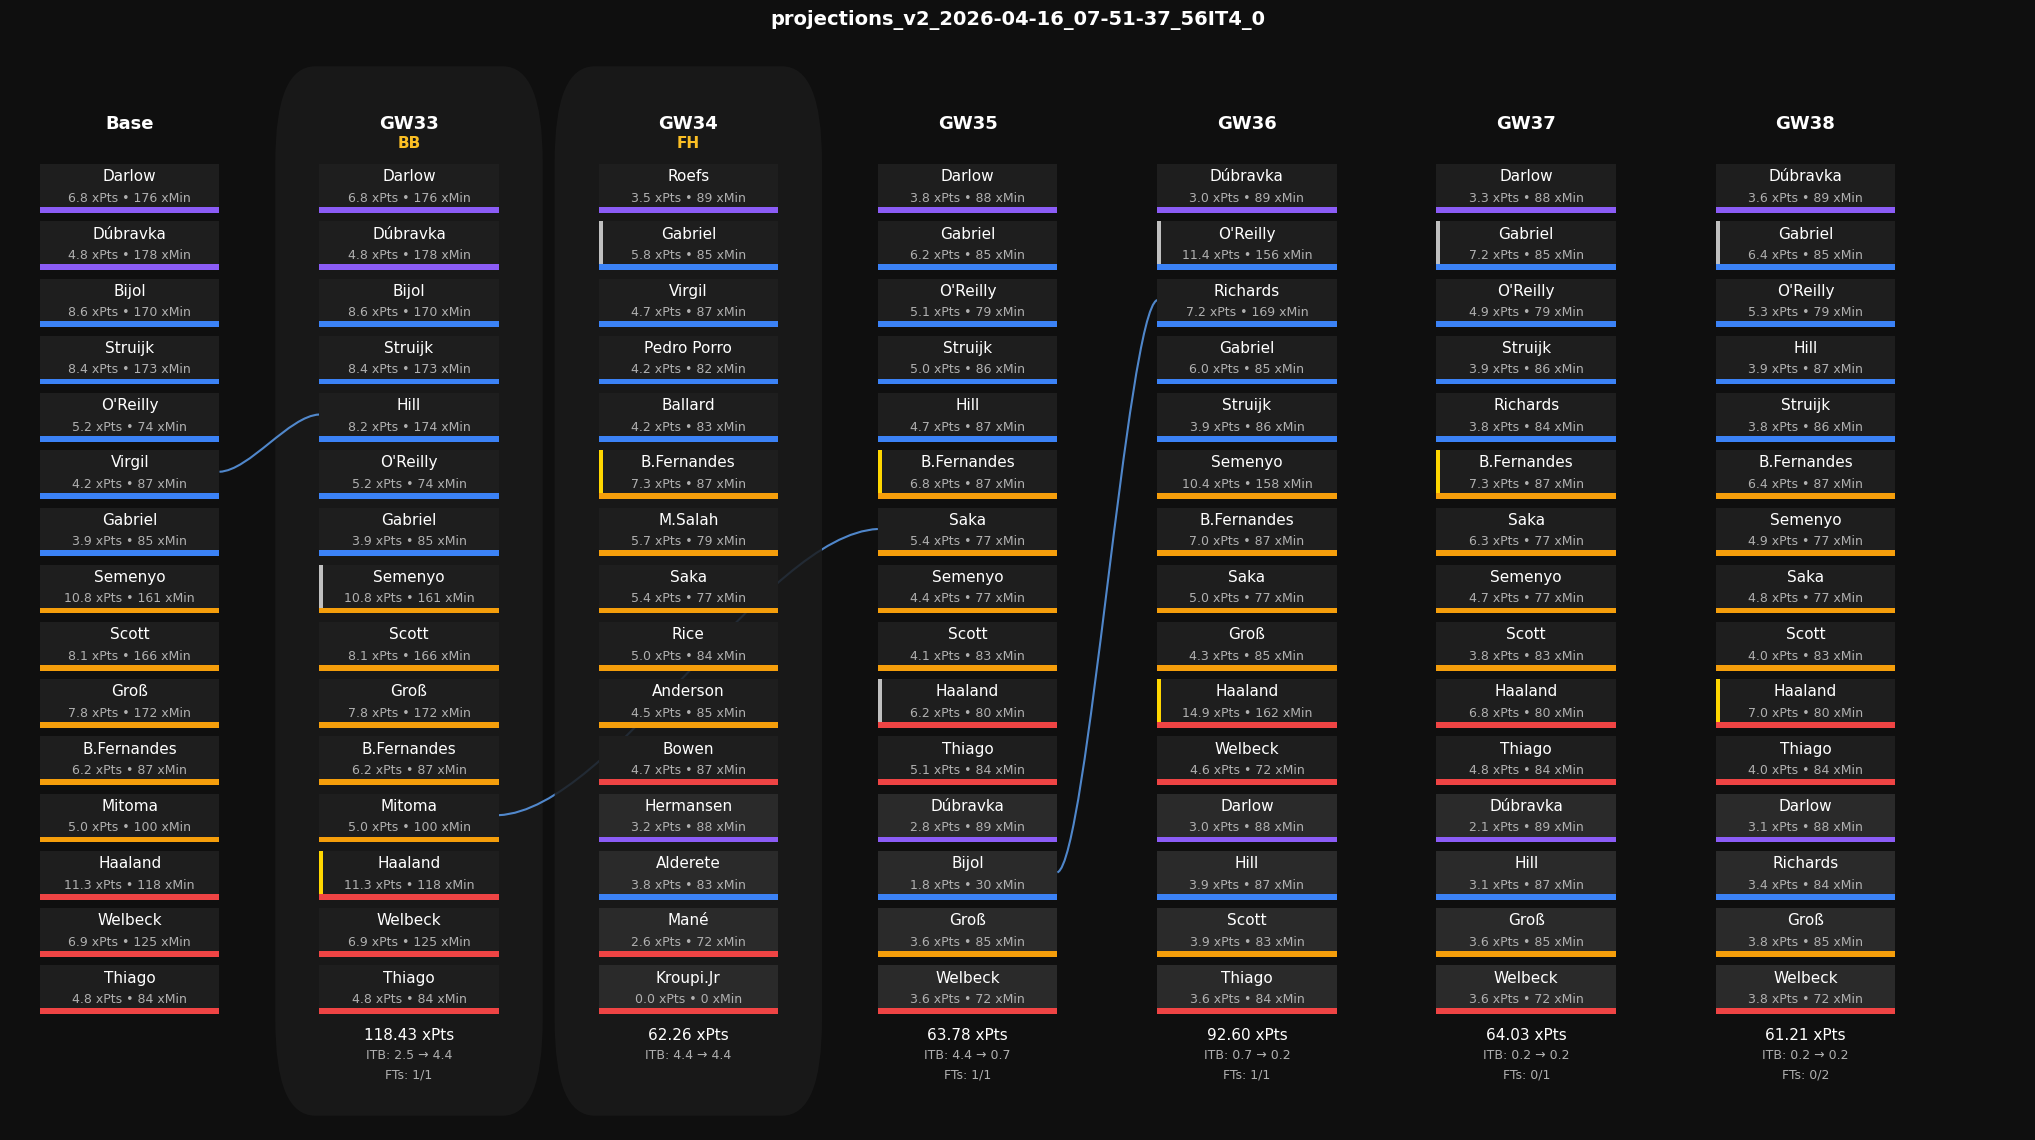
- Both models deploy BB chip in GW33, but pursue opposite transfer strategies: v1 upgrades attack (Welbeck→João Pedro), v2 upgrades defense (Virgil→Hill)
- v1’s z-score adjustments consistently downgrade players with low elite ownership, creating systematic projection gaps
Squad Picks (GW33)
The models show strong positional alignment with identical captaincy on Haaland and vice-captaincy on Semenyo, reflecting consensus on premium picks. Key divergence occurs in defense where v2 favors Hill (8.19 xP) over v1’s O’Reilly/Virgil combination, contributing significantly to v2’s 6.5-point XI advantage. Both models prioritize Brighton assets with Groß/Scott rotation and include Mitoma, while maintaining similar midfield structures around Bruno Fernandes. The forward lines differ with v1 preferring João Pedro (8.48 xP) over v2’s Welbeck (6.92 xP), though this gap is offset by v2’s stronger defensive selections.
| Slot | v1_Player | v1_xP | v2_Player | v2_xP | Match |
|---|---|---|---|---|---|
| XI | Darlow | 5.83 | Darlow | 6.78 | = |
| XI | Dúbravka | 4.25 | Dúbravka | 4.85 | = |
| XI | Bijol | 7.55 | Bijol | 8.62 | = |
| XI | Struijk | 7.25 | Struijk | 8.42 | = |
| XI | O’Reilly | 5.23 | Hill | 8.19 | DIFF |
| XI | Virgil | 4.28 | O’Reilly | 5.23 | DIFF |
| XI | Gabriel | 3.92 | Gabriel | 3.92 | = |
| XI | Semenyo (V) | 11.36 | Semenyo (V) | 10.81 | = |
| XI | Groß | 7.66 | Scott | 8.07 | ~ |
| XI | Scott | 7.00 | Groß | 7.85 | ~ |
| XI | B.Fernandes | 6.23 | B.Fernandes | 6.23 | = |
| XI | Mitoma | 4.81 | Mitoma | 5.04 | = |
| XI | Haaland (C) | 11.53 | Haaland (C) | 11.35 | = |
| XI | João Pedro | 8.48 | Welbeck | 6.92 | DIFF |
| XI | Thiago | 5.25 | Thiago | 4.79 | = |
Transfer Plan
Both models deploy BB chips in GW33 but pursue contrasting transfer philosophies that reveal their core differences. v1 executes an attacking upgrade from Welbeck to João Pedro, betting on the higher-owned asset despite similar baseline projections. v2 makes a defensive move from Virgil to Hill, capitalizing on a player with strong fundamentals but low elite ownership that v1’s z-score system penalizes. The longer-term plans diverge further, with v1 focusing on premium upgrades (Verbruggen, Sarr) while v2 targets high-value picks that elite managers may be overlooking (Saka, Richards).
| GW | v1_Transfers | v1_Chip | v2_Transfers | v2_Chip | Match |
|---|---|---|---|---|---|
| 33 | Welbeck -> João Pedro | BB | Virgil -> Hill | BB | DIFF |
| 34 | Roll | FH | Roll | FH | = |
| 35 | Dúbravka -> Verbruggen | Mitoma -> Saka | DIFF | ||
| 36 | Mitoma -> Sarr | Bijol -> Richards | DIFF | ||
| 37 | Roll | Roll | = | ||
| 38 | Roll | Roll | = |
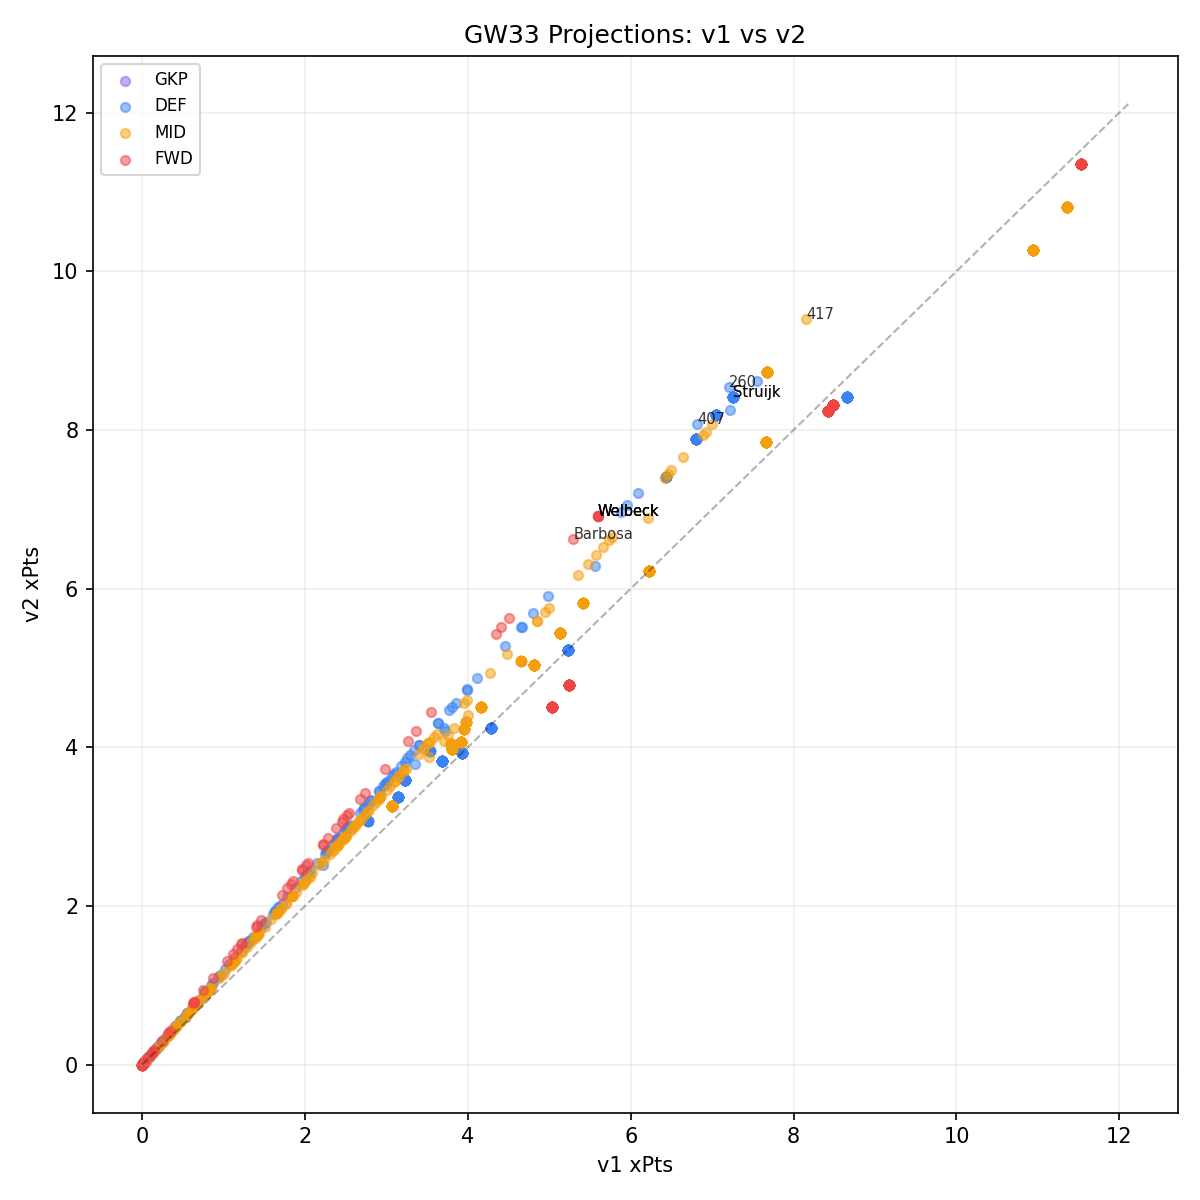
Model Divergence
The projection gaps reveal v1’s systematic downgrading of players with minimal elite ownership, as seen in the top divergences where all players show near-zero elite EEO. Hill and Struijk exemplify this pattern - both offer strong value (8.19 and 8.42 baseline xP) but get penalized 1.14 and 1.17 points respectively by v1’s z-score adjustments. Welbeck represents the clearest strategic divide, where v2 maintains confidence in his 6.92 baseline projection while v1 downgrades him to 5.59, directly influencing the opposing transfer decisions. This suggests v1 may be overfitting to elite manager preferences while v2 captures value in overlooked assets with strong underlying metrics.
| Name | Pos | Team | v1_xP | v2_xP | delta |
|---|---|---|---|---|---|
| Marc Guéhi | DEF | Man City | 7.21 | 8.54 | 1.33 |
| Danny Welbeck | FWD | Brighton | 5.59 | 6.92 | 1.33 |
| Francisco Evanilson de Lima Barbosa | FWD | Bournemouth | 5.30 | 6.62 | 1.32 |
| Matheus Nunes | DEF | Man City | 6.82 | 8.08 | 1.26 |
| Rayan Cherki | MID | Man City | 8.15 | 9.40 | 1.25 |
| Pascal Struijk | DEF | Leeds United | 7.25 | 8.42 | 1.17 |
| James Hill | DEF | Bournemouth | 7.05 | 8.19 | 1.14 |
| Eli Junior Kroupi | FWD | Bournemouth | 4.50 | 5.63 | 1.13 |
| Jayden Bogle | DEF | Leeds United | 6.09 | 7.21 | 1.12 |
| Zian Flemming | FWD | Burnley | 4.41 | 5.51 | 1.10 |
Charts