GW36 -- Preview
TLDR:
- Both models captain Haaland and agree on 7/11 starting XI picks including O’Reilly (V) and Semenyo
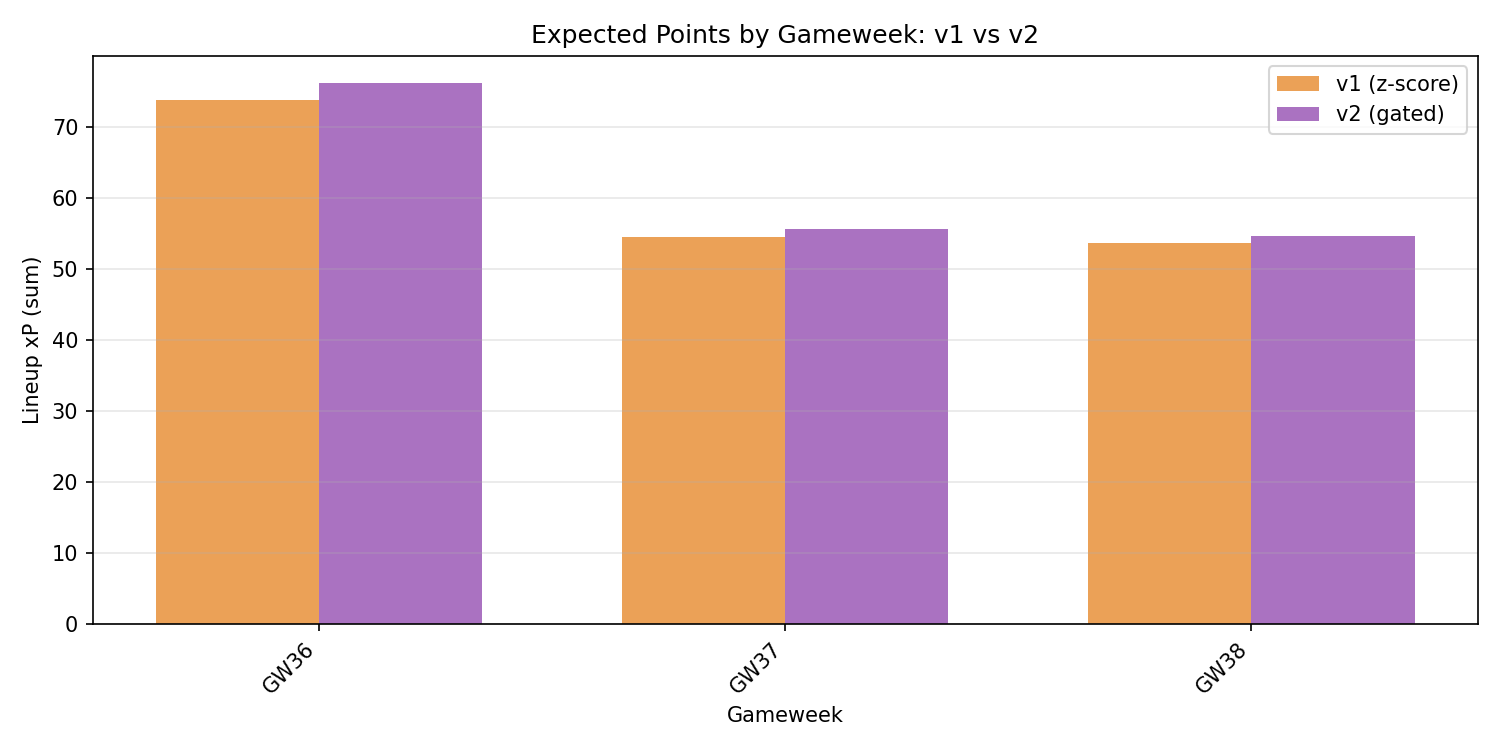
- v2 edges v1 on XI expected points (76.2 vs 73.8) despite similar core selections
- Transfer strategies diverge: v1 brings in Tavernier, v2 opts for Ndiaye upgrade
- Defensive swaps see v2 prefer Virgil over Struijk in starting lineup
- No chips deployed by either model for GW36
Squad Picks (GW36)
Both models converge on premium picks with Haaland captaincy and O’Reilly vice-captaincy forming the backbone. The 7/11 agreement includes key differentials like Semenyo (10.18/9.77 xP) and consistent performers like Gabriel and Bruno Fernandes. Main divergence occurs in midfield depth where v1 fields Tavernier and Scott while v2 prefers Groß and Ndiaye. Defensive reshuffling sees v2 promote Virgil (3.68 xP) to starting XI over Struijk (3.28 xP), suggesting different confidence thresholds in their projection adjustments.
| Slot | v1_Player | v1_xP | v2_Player | v2_xP | Match |
|---|---|---|---|---|---|
| XI | Raya | 3.62 | Raya | 3.48 | = |
| XI | O’Reilly (V) | 11.75 | O’Reilly (V) | 11.75 | = |
| XI | Gabriel | 5.38 | Gabriel | 5.27 | = |
| XI | Struijk | 3.28 | Virgil | 3.68 | ~ |
| XI | Semenyo | 10.18 | Semenyo | 9.77 | = |
| XI | B.Fernandes | 6.67 | B.Fernandes | 6.67 | = |
| XI | Tavernier | 5.08 | Groß | 4.87 | DIFF |
| XI | Scott | 3.26 | Ndiaye | 4.73 | DIFF |
| XI | Enzo | 3.23 | Scott | 3.95 | DIFF |
| XI | Haaland (C) | 16.88 | Haaland (C) | 16.88 | = |
| XI | Welbeck | 4.42 | Welbeck | 5.13 | = |
| B0 | Darlow | 3.31 | Darlow | 3.31 | = |
| B2 | Virgil | 2.94 | Bijol | 3.48 | ~ |
| B3 | Bijol | 2.87 | Struijk | 3.20 | ~ |
| B1 | Thiago | 3.01 | Thiago | 3.14 | = |
Transfer Plan
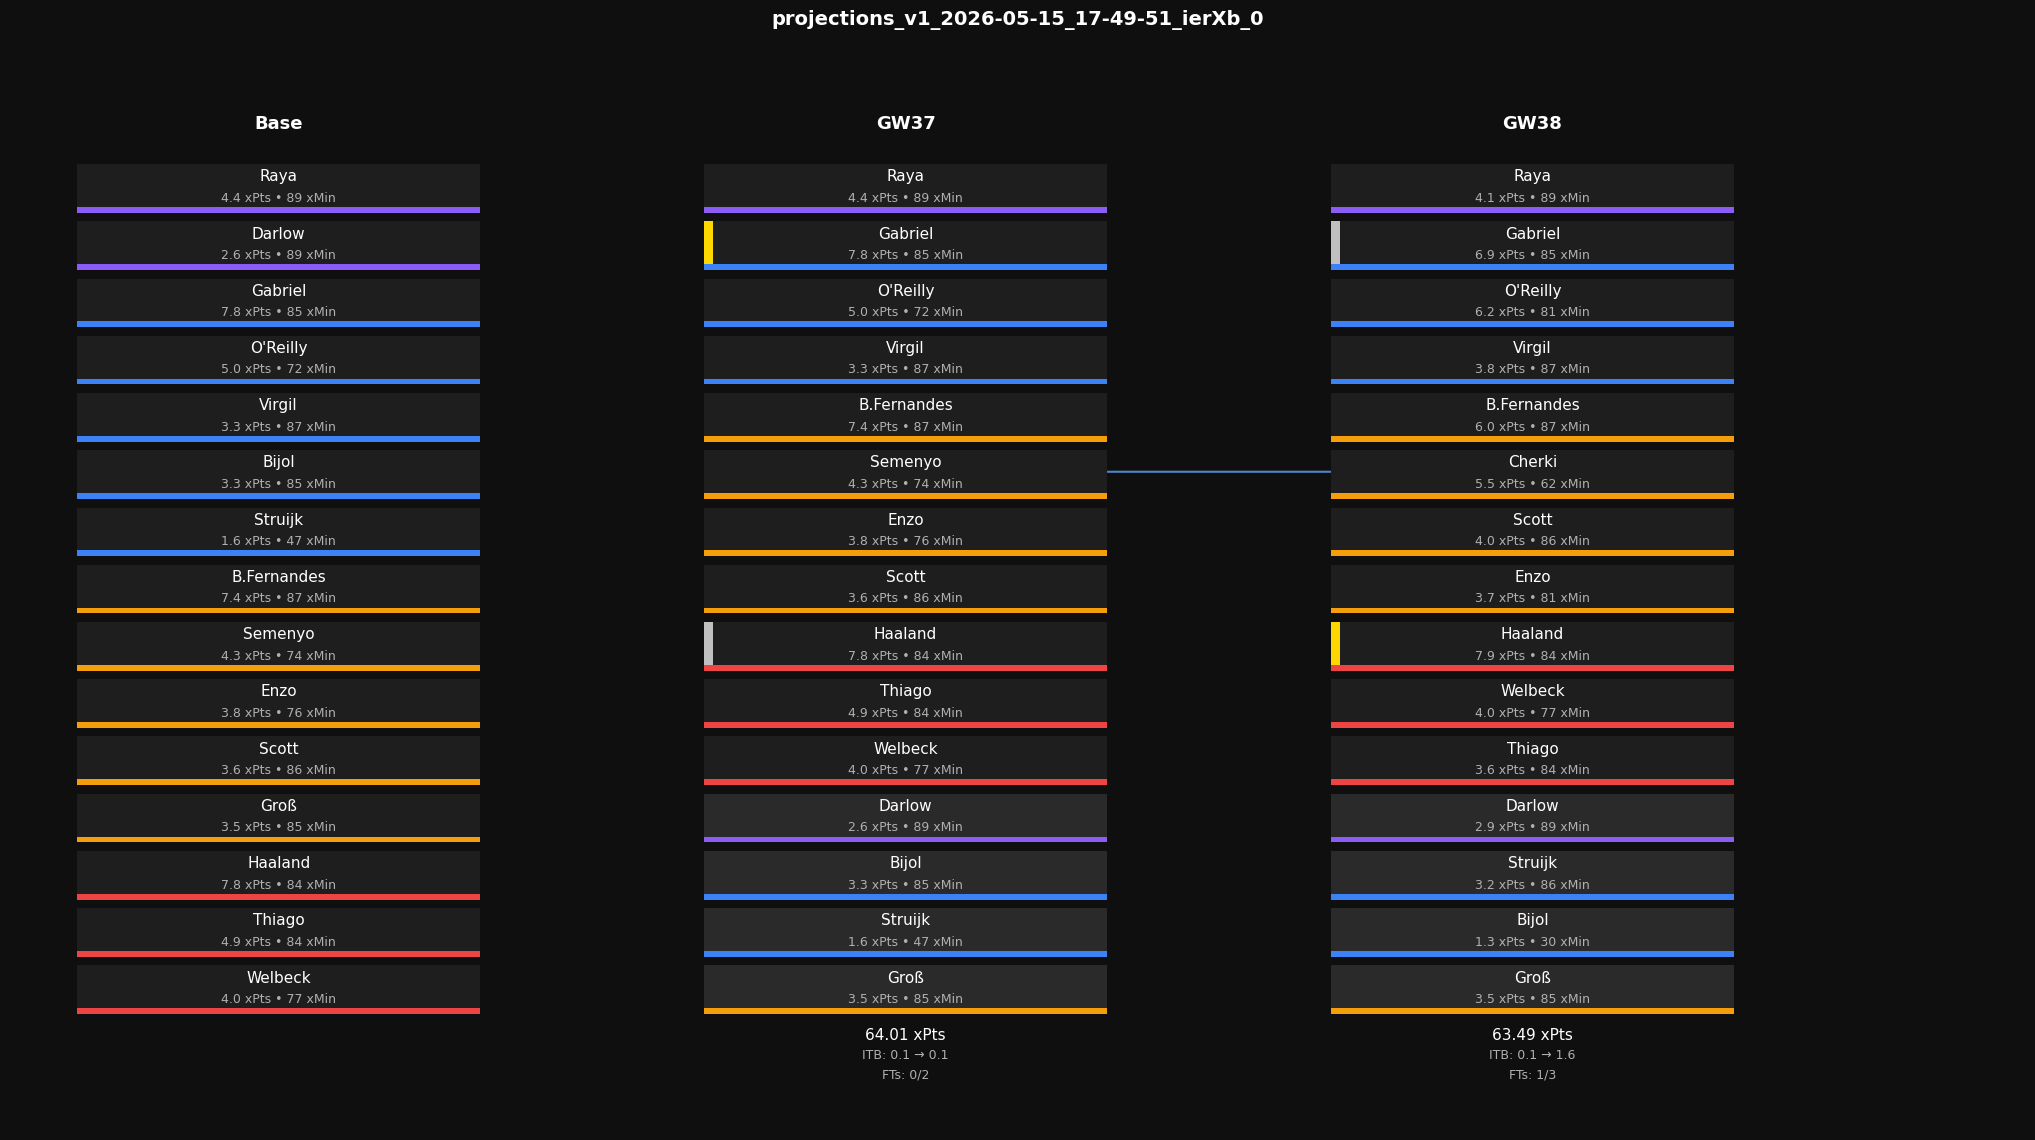
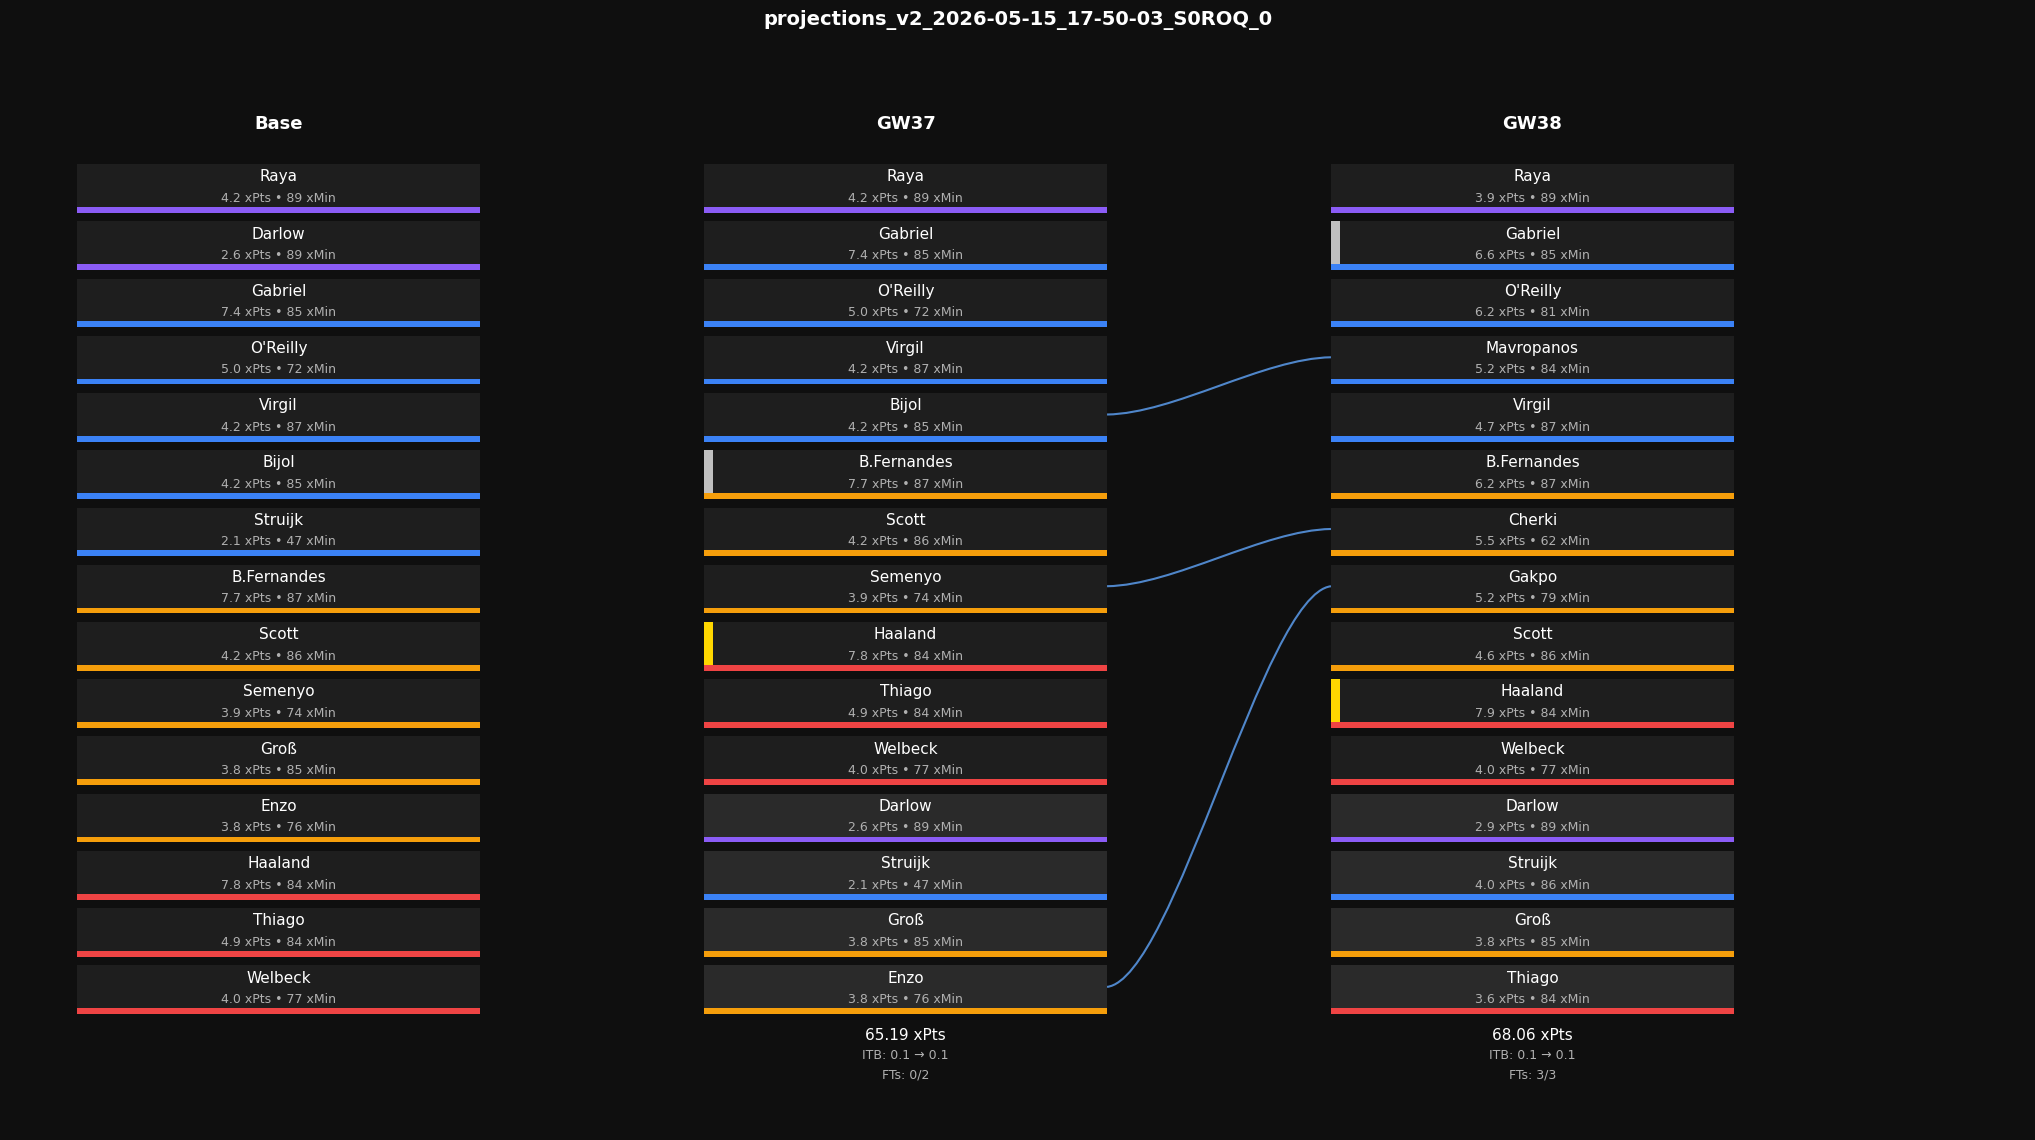
Transfer strategies reveal philosophical differences in targeting value picks. v1’s Groß -> Tavernier move (5.08 xP) suggests chasing form or fixtures, while v2’s Enzo -> Ndiaye upgrade (4.73 xP) indicates prioritizing higher ceiling players. Both models then roll transfers through GW37-38, suggesting these GW36 moves are tactical rather than structural. The single transfer approach from both models indicates squad satisfaction and likely preparation for final gameweeks without major overhauls.
| GW | v1_Transfers | v1_Chip | v2_Transfers | v2_Chip | Match |
|---|---|---|---|---|---|
| 36 | Groß -> Tavernier | Enzo -> Ndiaye | DIFF | ||
| 37 | Roll | Roll | = | ||
| 38 | Roll | Roll | = |
Model Divergence
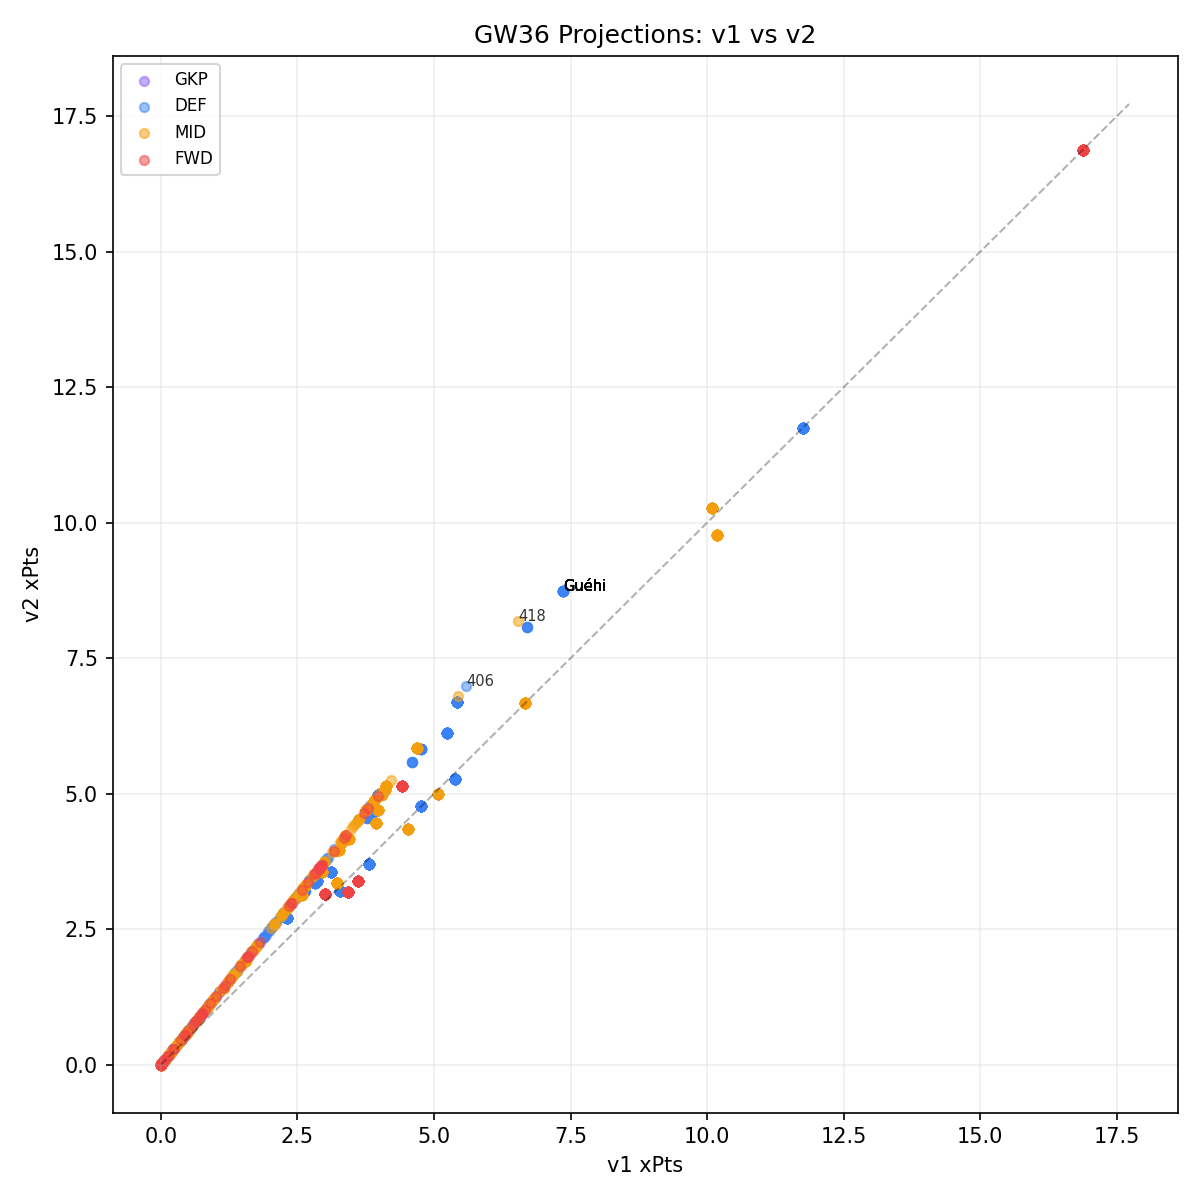
Projection divergences cluster heavily around Man City assets, with v1’s z-score heuristic significantly downgrading players like Doku (8.18 -> 6.54 xP) and Khusanov (6.98 -> 5.58 xP) due to zero elite ownership. The confidence-gated v2 model maintains baseline projections for these low-signal players, creating 1.3-1.6 point gaps. Crystal Palace assets like Guéhi and Lacroix show similar patterns, indicating v1’s aggressive adjustment of non-elite-owned players while v2’s conservative approach preserves original projections when confidence is lacking.
| Name | Pos | Team | v1_xP | v2_xP | delta |
|---|---|---|---|---|---|
| Jérémy Doku | MID | Man City | 6.54 | 8.18 | 1.64 |
| Abdukodir Khusanov | DEF | Man City | 5.58 | 6.98 | 1.40 |
| Marc Guéhi | DEF | Man City | 7.36 | 8.74 | 1.38 |
| Matheus Nunes | DEF | Man City | 6.71 | 8.08 | 1.37 |
| ID:736 | GK | Man City | 5.47 | 6.84 | 1.37 |
| Bernardo Mota Veiga de Carvalho e Silva | MID | Man City | 5.45 | 6.81 | 1.36 |
| Maxence Lacroix | DEF | Crystal Palace | 5.42 | 6.70 | 1.28 |
| Ismaïla Sarr | MID | Crystal Palace | 4.68 | 5.85 | 1.17 |
| Cody Gakpo | MID | Liverpool | 4.21 | 5.26 | 1.05 |
| ID:723 | DEF | Crystal Palace | 4.77 | 5.82 | 1.05 |
Charts